What we are going to build
In the last post I have shown how to do linear interpolation of gaps using SQL and Window Functions:
So SQL is absolutely capable of timeseries analysis tasks and Window Functions are a powerful tool, that make your life a lot easier. But SQL still required us to write a quite complex function and the query needs a lot more optimization as soon as the datasets get bigger.
In this post I want to show how to detect gaps and interpolate values using InfluxDB.
All code for this article is available at:
What is InfluxDB?
InfluxDB is a database written specifically for handling time series data.
The influxdata website writes on InfluxDB:
InfluxDB is a high-performance data store written specifically for time series data. It allows for high throughput ingest, compression and real-time querying of that same data. InfluxDB is written entirely in Go and it compiles into a single binary with no external dependencies.
Dataset
The dataset is the Quality Controlled Local Climatological Data (QCLCD) for 2014 and 2015. It contains hourly weather measurements for more than 1,600 US Weather Stations. It is a great dataset to learn about data processing and data visualization:
The Quality Controlled Local Climatological Data (QCLCD) consist of hourly, daily, and monthly summaries for approximately 1,600 U.S. locations. Daily Summary forms are not available for all stations. Data are available beginning January 1, 2005 and continue to the present. Please note, there may be a 48-hour lag in the availability of the most recent data.
The data is available as CSV files at:
Download the file QCLCD201503.zip from:
Quality Controlled Local Climatological Data (QCLCD):
Preparing InfluxDB
Creating the Database
Before running the Java Application to insert the data, you have to create the InfluxDB database:
G:\InfluxDB>influx.exe
Connected to http://localhost:8086 version 1.7.1
InfluxDB shell version: 1.7.1
Enter an InfluxQL query

> CREATE DATABASE "weather_data" WITH DURATION inf REPLICATION 1 SHARD DURATION 4w NAME "weather_data_policy"
Adjusting the Configuration
In the influxdb.conf I am setting the cache-snapshot-write-cold-duration to 5 seconds for flushing
the caches more agressively, when writing historical data:
cache-snapshot-write-cold-duration = "5s"
Running the Sample Application
The application is a Java application, which can be started with an IDE of your choice:
If you didn't go with the above database, then you probably have to adjust the database and retention policy:
static final String databaseName = "weather_data";
static final String retentionPolicyName = "weather_data_policy";
The application uses http://localhost:8086 by default:
InfluxDB influxDB = InfluxDBFactory.connect("http://localhost:8086");
And change the path to the CSV files, if the path differs:
final Path csvStationDataFilePath = FileSystems.getDefault().getPath("D:\\datasets\\201503station.txt");
final Path csvLocalWeatherDataFilePath = FileSystems.getDefault().getPath("D:\\datasets\\201503hourly.txt");
Once executed the application parses the CSV files and writes the data into the specified database.
Influx Queries
First of all start the Influx CLI and select the database to work on:
G:\InfluxDB>influx.exe
Connected to http://localhost:8086 version 1.7.1
InfluxDB shell version: 1.7.1
Enter an InfluxQL query

> use weather_data
Setting Readable Timestamps
To format the timestamps in a human readable format set the timestamp precision to rfc3339:
> precision rfc3339
Missing Data
First of all we will get the minutes between two timestamps for each weather station. This can be easily done using the ELAPSED operator:
SELECT ELAPSED("temperature", 1m) AS "timespan" INTO "elapsed_minutes" FROM "weather_measurement" group by "wban"
Now we can query the elapsed_minutes table to get the number of timestamps, where we have missing values:
> SELECT count(*) FROM "elapsed_minutes" WHERE "timespan" > 60
name: elapsed_minutes
time count_timespan
---- --------------
0    5754
Linear Interpolate Data
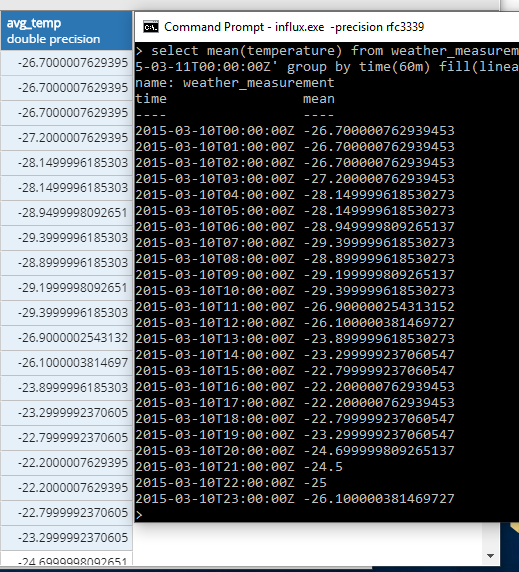
Where InfluxDB really shines are tasks like Linear interpolation, which can be done easily with a group by query. So to get the linear interpolated temperatures for station 00102 we can write:
SELECT mean("temperature") FROM "weather_measurement" WHERE time > '2015-03-01T00:00:00Z' and time < '2015-03-31T00:00:00Z' and "wban" = '00102' group by time(60m) fill(linear)
Which returns the following results:
time                 mean
----                 ----
2015-03-01T00:00:00Z -25.600000381469727
2015-03-01T01:00:00Z -26.700000762939453
2015-03-01T02:00:00Z -25.600000381469727
2015-03-01T03:00:00Z -25.600000381469727
2015-03-01T04:00:00Z -26.700000762939453
2015-03-01T05:00:00Z -26.700000762939453
2015-03-01T06:00:00Z -26.700000762939453
2015-03-01T07:00:00Z -26.100000381469727
2015-03-01T08:00:00Z -26.700000762939453
2015-03-01T09:00:00Z -26.100000381469727
2015-03-01T10:00:00Z -25
2015-03-01T11:00:00Z -23.899999618530273
2015-03-01T12:00:00Z -23.899999618530273
2015-03-01T13:00:00Z -21.700000762939453
2015-03-01T14:00:00Z -18.899999618530273

[...]
We can compare this with the PostgreSQL version and see, that we have interpolated the same values:
